The Net Zero Economy
Lowering the carbon intensity of oil and natural gas has become a common-sense business strategy to ensure access to capital and take advantage of a broad range of incentives. A growing number of companies are committing to net-zero carbon emissions – a target that will be both expensive and technically challenging to achieve over the coming years and decades. Building a roadmap to net-zero (or any GHG target) is the first step on the journey to decarbonization. However, most companies don’t know where to start.
For a given company, thousands of potential abatement projects may exist, and the best projects depend on a myriad of factors. It can be a confusing process to screen competing projects that promise both environmental benefit and smart economics. At times, Highwood engages with companies that lack a clear plan or long-term strategy to manage these projects. Scattered decision-making often leads to delayed GHG reductions, wasted money, and missed opportunities.
Increasingly, investors and end users reward companies that achieve and demonstrate true emissions reductions in a cost competitive fashion. But how to get there? Various analytical tools for optimizing emissions management initiatives exist. A leader among them is the Marginal Abatement Cost Curve (MACC).
Introducing the MACC
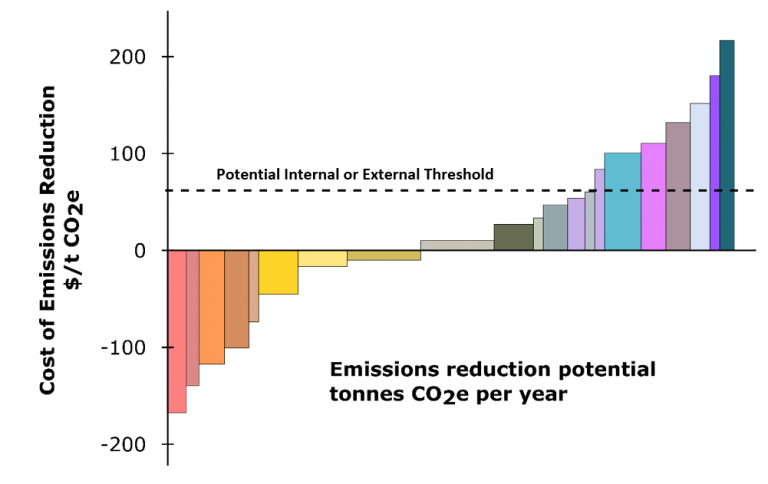
A MACC is a simple tool for presenting GHG emission reduction options relative to a “business-as-usual” pathway. A MACC presents a range of possible mitigation options using a basic metric: economic cost of emissions reductions. MACCs are broken into discrete projects and each project represents an individual or set of similar carbon reduction projects. Figure 1.0 below illustrates a basic MACC.
For each project in the plot, the horizontal width indicates the amount of potential carbon emissions abatement (tCO2e) while the vertical height estimates the marginal cost of the carbon emissions abatement ($/tCO2e). The projects are ordered such that the most attractive projects are located on the left side of the plot followed by projects of decreasing value to the right. Sometimes, projects on the left have a negative cost of mitigation (you make money!), depending on the incentives available. Additionally, organizations may also have internal or external governance guiding an abatement cost threshold for potential GHG reduction projects indicated by the horizontal dashed line in Figure 1.0.
Customizing the MACC
MACCs allow projects in differing sectors (e.g., Oil & Gas vs. Power Generation) to be compared on equal terms and often serve as a springboard to identify and present several GHG reducing projects from which deeper analysis can evolve. Highwood provides its clients both simple (standard) MACC development and more refined custom MACC services. Our custom MACCs incorporate client-specific opportunities and costs, project complexity, ease of implementation, and manage abatement dependencies via scenario analysis.
Highwood has developed a custom set of software tools to efficiently build custom MACCs and optimize emissions reduction planning. These tools have a significant advantage over generic MACC modeling by offering in-depth investigation of viable mitigation opportunities and associated strategy. With our industry leading GHG knowledge and expertise, Highwood can help your organization navigate MACC construction and analysis, catalyzing cost-effective strategies for meeting corporate emission reduction targets with long term vision.